Java Is Open Source Programming Language You Can Download From Java and Java Libraries From http://www.oracle.com.
We provide this code related to title for you to solve your developing problem easily. Libraries which is import in this program you can download from http://www.oracle.com.
Draw Math Function Your Own
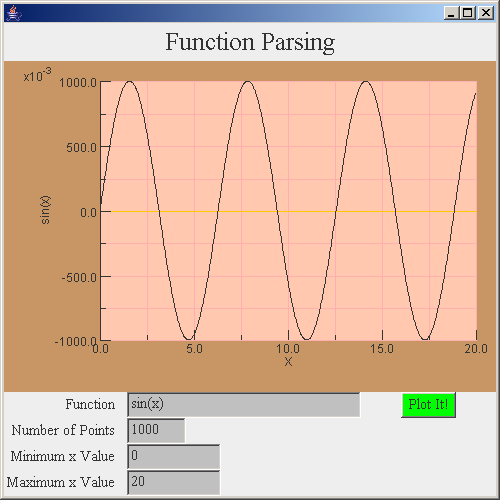
import java.awt.*;
import java.applet.*;

import graph.*;
/*
**************************************************************************
**
**                      Applet parse1d
**
**************************************************************************
**    Copyright (C) 1995, 1996 Leigh Brookshaw
**
**    This program is free software; you can redistribute it and/or modify
**    it under the terms of the GNU General Public License as published by
**    the Free Software Foundation; either version 2 of the License, or
**    (at your option) any later version.
**
**    This program is distributed in the hope that it will be useful,
**    but WITHOUT ANY WARRANTY; without even the implied warranty of
**    MERCHANTABILITY or FITNESS FOR A PARTICULAR PURPOSE.  See the
**    GNU General Public License for more details.
**
**    You should have received a copy of the GNU General Public License
**    along with this program; if not, write to the Free Software
**    Foundation, Inc., 675 Mass Ave, Cambridge, MA 02139, USA.
**************************************************************************
*
* This applet uses the ParseFunction class to parse an input string
* and plot the result.
*
*************************************************************************/

public class parse1d extends Applet {

      G2Dint graph         = new G2Dint();   // Graph class to do the plotting
      Axis xaxis;
      Axis yaxis;
      DataSet data;

      TextField pinput     = new TextField(5);       // Number of points
      TextField mininput   = new TextField(10);      // Minimum x value input
      TextField maxinput   = new TextField(10);      // Maximum x value input
      TextField finput     = new TextField(30);      // Input for the function to plot
      Button plot          = new Button("Plot It!"); // Button to plot it.


      public void init() {
         Label title            = new Label("Function Parsing",Label.CENTER);
         Panel panel            = new Panel();
         GridBagLayout gridbag  = new GridBagLayout();
         GridBagConstraints  c  = new GridBagConstraints();
         Font font              = new Font("TimesRoman",Font.PLAIN,15);

         title.setFont(new Font("TimesRoman",Font.PLAIN,25));


         setLayout(new BorderLayout() );
         add("North",title);
         add("Center",panel);

         finput.setText("sin(x)");
         pinput.setText("1000");
         mininput.setText("0");
         maxinput.setText("20");


         panel.setLayout(gridbag);

         Label plabel   = new Label("Number of Points");
         Label minlabel = new Label("Minimum x Value");
         Label maxlabel = new Label("Maximum x Value");
         Label flabel   = new Label("Function");

         plabel.setFont(font);
         flabel.setFont(font);
         minlabel.setFont(font);
         maxlabel.setFont(font);

         pinput.setFont(font);
         pinput.setBackground(Color.lightGray);
         finput.setFont(font);
         finput.setBackground(Color.lightGray);
         mininput.setFont(font);
         mininput.setBackground(Color.lightGray);
         maxinput.setFont(font);
         maxinput.setBackground(Color.lightGray);
         plot.setFont(font);
         plot.setBackground(Color.green);

         c.weightx = 1.0;
         c.weighty = 1.0;
         c.gridwidth = 3;
         c.gridwidth=GridBagConstraints.REMAINDER;
         c.fill  =  GridBagConstraints.BOTH;

         gridbag.setConstraints(graph,c);

         c.fill  =  GridBagConstraints.NONE;
         c.weightx=0.0;
         c.weighty=0.0;
         c.gridheight=1;

         c.gridwidth=1;
         c.anchor = GridBagConstraints.EAST;
         gridbag.setConstraints(flabel,c);

         c.anchor = GridBagConstraints.CENTER;
         c.gridwidth=GridBagConstraints.RELATIVE;
         c.fill  =  GridBagConstraints.HORIZONTAL;
         gridbag.setConstraints(finput,c);

         c.fill = GridBagConstraints.NONE;
         c.gridwidth=GridBagConstraints.REMAINDER;

         gridbag.setConstraints(plot,c);


         c.gridwidth=1;
         c.anchor = GridBagConstraints.EAST;
         gridbag.setConstraints(plabel,c);
         c.gridwidth=2;
         c.anchor = GridBagConstraints.WEST;
         c.gridwidth=GridBagConstraints.REMAINDER;
         gridbag.setConstraints(pinput,c);

         c.gridwidth=1;
         c.anchor = GridBagConstraints.EAST;
         gridbag.setConstraints(minlabel,c);
         c.gridwidth=2;
         c.anchor = GridBagConstraints.WEST;
         c.gridwidth=GridBagConstraints.REMAINDER;
         gridbag.setConstraints(mininput,c);

         c.gridwidth=1;
         c.anchor = GridBagConstraints.EAST;
         gridbag.setConstraints(maxlabel,c);
         c.gridwidth=2;
         c.anchor = GridBagConstraints.WEST;
         c.gridwidth=GridBagConstraints.REMAINDER;
         gridbag.setConstraints(maxinput,c);


         panel.add(graph);
         panel.add(flabel);
         panel.add(finput);
         panel.add(plot);
         panel.add(plabel);
         panel.add(pinput);
         panel.add(minlabel);
         panel.add(mininput);
         panel.add(maxlabel);
         panel.add(maxinput);


         xaxis = graph.createXAxis();
         xaxis.setTitleText("X");

         yaxis = graph.createYAxis();


         data = new DataSet();

         xaxis.attachDataSet(data);
         yaxis.attachDataSet(data);
         graph.attachDataSet(data);


         graph.setDataBackground(new Color(255,200,175));
         graph.setBackground(new Color(200,150,100));

         plot();

      }


      void plot() {
         int points;
         double maximum;
         double minimum;
         double x;
         int count = 0;
         boolean error = false;

         try {
              points   = Integer.parseInt(pinput.getText());
         } catch(Exception e) {
//              this.showStatus("Error with number of points!");
              System.out.println("Number of points error "+e.getMessage());
              return;
         }

         try {
            maximum = Double.valueOf(maxinput.getText()).doubleValue();
         } catch(Exception e) {
  //            this.showStatus("Error with X maximum value!");
              System.out.println("X maximum error "+e.getMessage());
              return;
         }

         try {
            minimum = Double.valueOf(mininput.getText()).doubleValue();
         } catch(Exception e) {
    //          this.showStatus("Error with X minimum value!");
              System.out.println("X minimum error "+e.getMessage());
              return;
         }

         ParseFunction function = new ParseFunction(finput.getText());

         if(!function.parse()) {
      //        this.showStatus("Failed to parse function!");
              System.out.println("Failed to parse function!");
              return;
         }

         double d[] = new double[2*points];

        // this.showStatus("Calculating points!");

         for(int i=0; i<points; i++) {

             x = minimum + i*(maximum-minimum)/(points-1);
             d[count] = x;
             try {
                  d[count+1] = function.getResult(x);
                  count += 2;
             } catch(Exception e) { error = true; }

         }


         if(count <= 2) {
//             this.showStatus("Error NO POINTS to PLOT!");
             System.out.println("Error NO POINTS to PLOT!");
             return;
         } else
         if( error ) {
  //           this.showStatus("Error while Calculating points!");
             System.out.println("Error while calculating points!");
   }


         yaxis.setTitleText(finput.getText());

         data.deleteData();

         try {
               data.append(d,count/2);
         } catch(Exception e) {
    //         this.showStatus("Error while appending data!");
             System.out.println("Error while appending data!");
             return;
   }


         graph.repaint();
      }


     public boolean action(Event e, Object a) {

         if(e.target instanceof Button) {
             if( plot.equals(e.target) ) {
                  plot();
                  return true;
             }
         }


         return false;
       }


      public static void main(String[] a){
         javax.swing.JFrame f = new javax.swing.JFrame();
         Applet app = new parse1d();
         app.init();

         f.getContentPane().add (app);

         f.pack();
         f.setSize (new Dimension (500, 500));
         f.setVisible(true);
      }

}