Java Is Open Source Programming Language You Can Download From Java and Java Libraries From http://www.oracle.com.
We provide this code related to title for you to solve your developing problem easily. Libraries which is import in this program you can download from http://www.oracle.com.
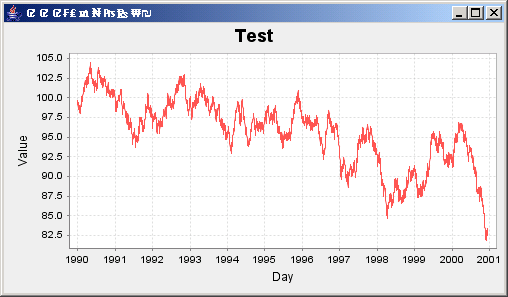
JFreeChart: Time Series Demo 5 with 4000 data points
/* ===========================================================
 * JFreeChart : a free chart library for the Java(tm) platform
 * ===========================================================
 *
 * (C) Copyright 2000-2004, by Object Refinery Limited and Contributors.
 *
 * Project Info:  http://www.jfree.org/jfreechart/index.html
 *
 * This library is free software; you can redistribute it and/or modify it under the terms
 * of the GNU Lesser General Public License as published by the Free Software Foundation;
 * either version 2.1 of the License, or (at your option) any later version.
 *
 * This library is distributed in the hope that it will be useful, but WITHOUT ANY WARRANTY;
 * without even the implied warranty of MERCHANTABILITY or FITNESS FOR A PARTICULAR PURPOSE.
 * See the GNU Lesser General Public License for more details.
 *
 * You should have received a copy of the GNU Lesser General Public License along with this
 * library; if not, write to the Free Software Foundation, Inc., 59 Temple Place, Suite 330,
 * Boston, MA 02111-1307, USA.
 *
 * [Java is a trademark or registered trademark of Sun Microsystems, Inc.
 * in the United States and other countries.]
 *
 * --------------------
 * TimeSeriesDemo5.java
 * --------------------
 * (C) Copyright 2001-2004, by Object Refinery Limited and Contributors.
 *
 * Original Author:  David Gilbert (for Object Refinery Limited);
 * Contributor(s):   -;
 *
 * $Id: TimeSeriesDemo5.java,v 1.12 2004/04/26 19:12:03 taqua Exp $
 *
 * Changes (from 24-Apr-2002)
 * --------------------------
 * 24-Apr-2002 : Added standard header (DG);
 * 10-Oct-2002 : Renamed JFreeChartDemo2 --> TimeSeriesDemo5 (DG);
 *
 */

package org.jfree.chart.demo;

import org.jfree.chart.ChartFactory;
import org.jfree.chart.ChartPanel;
import org.jfree.chart.JFreeChart;
import org.jfree.data.general.SeriesException;
import org.jfree.data.time.Day;
import org.jfree.data.time.TimeSeries;
import org.jfree.data.time.TimeSeriesCollection;
import org.jfree.data.xy.XYDataset;
import org.jfree.ui.ApplicationFrame;
import org.jfree.ui.RefineryUtilities;

/**
 * A time series chart with 4000 data points, to get an idea of how JFreeChart performs with a
 * larger dataset.  You can see that it slows down significantly, so this needs to be worked on
 * (4000 points is not that many!).
 *
 */
public class TimeSeriesDemo5 extends ApplicationFrame {

    /**
     * Creates a new demo instance.
     *
     * @param title  the frame title.
     */
    public TimeSeriesDemo5(final String title) {

        super(title);
        final XYDataset dataset = createDataset();
        final JFreeChart chart = createChart(dataset);
        final ChartPanel chartPanel = new ChartPanel(chart);
        chartPanel.setPreferredSize(new java.awt.Dimension(500, 270));
        chartPanel.setMouseZoomable(true, false);
        setContentPane(chartPanel);

    }

    /**
     * Creates a sample dataset.
     *
     * @return A sample dataset.
     */
    private XYDataset createDataset() {

        final TimeSeries series = new TimeSeries("Random Data");
        Day current = new Day(1, 1, 1990);
        double value = 100.0;
        for (int i = 0; i < 4000; i++) {
            try {
                value = value + Math.random() - 0.5;
                series.add(current, new Double(value));
                current = (Day) current.next();
            }
            catch (SeriesException e) {
                System.err.println("Error adding to series");
            }
        }
        return new TimeSeriesCollection(series);
    }

    /**
     * Creates a sample chart.
     *
     * @param dataset  the dataset.
     *
     * @return A sample chart.
     */
    private JFreeChart createChart(final XYDataset dataset) {
        return ChartFactory.createTimeSeriesChart(
            "Test",
            "Day",
            "Value",
            dataset,
            false,
            false,
            false
        );
    }

    // ****************************************************************************
    // * JFREECHART DEVELOPER GUIDE                                               *
    // * The JFreeChart Developer Guide, written by David Gilbert, is available   *
    // * to purchase from Object Refinery Limited:                                *
    // *                                                                          *
    // * http://www.object-refinery.com/jfreechart/guide.html                     *
    // *                                                                          *
    // * Sales are used to provide funding for the JFreeChart project - please    *
    // * support us so that we can continue developing free software.             *
    // ****************************************************************************

    /**
     * Starting point for the application.
     *
     * @param args  ignored.
     */
    public static void main(final String[] args) {

        final String title = "u20A2u20A2u20A2u20A3u20A4u20A5u20A6u20A7u20A8u20A9u20AA";
        final TimeSeriesDemo5 demo = new TimeSeriesDemo5(title);
        demo.pack();
        RefineryUtilities.positionFrameRandomly(demo);
        demo.setVisible(true);

    }

}
