Java Is Open Source Programming Language You Can Download From Java and Java Libraries From http://www.oracle.com.
We provide this code related to title for you to solve your developing problem easily. Libraries which is import in this program you can download from http://www.oracle.com.
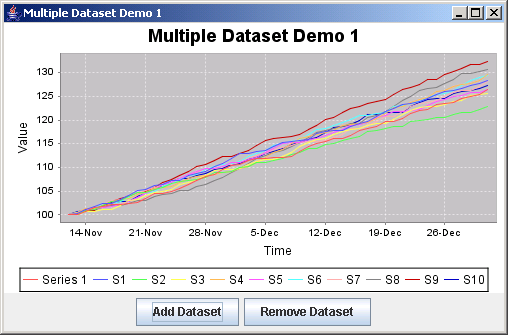
JFreeChart: Multiple Dataset Demo 1
/* ===========================================================
 * JFreeChart : a free chart library for the Java(tm) platform
 * ===========================================================
 *
 * (C) Copyright 2000-2004, by Object Refinery Limited and Contributors.
 *
 * Project Info:  http://www.jfree.org/jfreechart/index.html
 *
 * This library is free software; you can redistribute it and/or modify it under the terms
 * of the GNU Lesser General Public License as published by the Free Software Foundation;
 * either version 2.1 of the License, or (at your option) any later version.
 *
 * This library is distributed in the hope that it will be useful, but WITHOUT ANY WARRANTY;
 * without even the implied warranty of MERCHANTABILITY or FITNESS FOR A PARTICULAR PURPOSE.
 * See the GNU Lesser General Public License for more details.
 *
 * You should have received a copy of the GNU Lesser General Public License along with this
 * library; if not, write to the Free Software Foundation, Inc., 59 Temple Place, Suite 330,
 * Boston, MA 02111-1307, USA.
 *
 * [Java is a trademark or registered trademark of Sun Microsystems, Inc.
 * in the United States and other countries.]
 *
 * --------------------------
 * SecondaryDatasetDemo1.java
 * --------------------------
 * (C) Copyright 2004, by Object Refinery Limited.
 *
 * Original Author:  David Gilbert (for Object Refinery Limited).
 * Contributor(s):   -;
 *
 * $Id: MultipleDatasetDemo1.java,v 1.1 2004/05/21 14:22:35 mungady Exp $
 *
 * Changes
 * -------
 * 30-Jan-2004 : Version 1 (DG);
 *
 */

package org.jfree.chart.demo;

import java.awt.BorderLayout;
import java.awt.Color;
import java.awt.FlowLayout;
import java.awt.event.ActionEvent;
import java.awt.event.ActionListener;

import javax.swing.JButton;
import javax.swing.JPanel;

import org.jfree.chart.ChartFactory;
import org.jfree.chart.ChartPanel;
import org.jfree.chart.JFreeChart;
import org.jfree.chart.axis.NumberAxis;
import org.jfree.chart.axis.ValueAxis;
import org.jfree.chart.plot.XYPlot;
import org.jfree.chart.renderer.xy.StandardXYItemRenderer;
import org.jfree.data.time.Day;
import org.jfree.data.time.RegularTimePeriod;
import org.jfree.data.time.TimeSeries;
import org.jfree.data.time.TimeSeriesCollection;
import org.jfree.ui.ApplicationFrame;
import org.jfree.ui.RefineryUtilities;
import org.jfree.ui.Spacer;

/**
 * A demo showing the addition and removal of multiple datasets / renderers.
 */
public class MultipleDatasetDemo1 extends ApplicationFrame implements ActionListener {

    /** The plot. */
    private XYPlot plot;

    /** The index of the last dataset added. */
    private int datasetIndex = 0;

    /**
     * Constructs a new demonstration application.
     *
     * @param title  the frame title.
     */
    public MultipleDatasetDemo1(final String title) {

        super(title);
        final TimeSeriesCollection dataset1 = createRandomDataset("Series 1");
        final JFreeChart chart = ChartFactory.createTimeSeriesChart(
            "Multiple Dataset Demo 1", "Time", "Value", dataset1, true, true, false
        );
        chart.setBackgroundPaint(Color.white);

        this.plot = chart.getXYPlot();
        this.plot.setBackgroundPaint(Color.lightGray);
        this.plot.setDomainGridlinePaint(Color.white);
        this.plot.setRangeGridlinePaint(Color.white);
//        this.plot.setAxisOffset(new Spacer(Spacer.ABSOLUTE, 4, 4, 4, 4));
        final ValueAxis axis = this.plot.getDomainAxis();
        axis.setAutoRange(true);

        final NumberAxis rangeAxis2 = new NumberAxis("Range Axis 2");
        rangeAxis2.setAutoRangeIncludesZero(false);

        final JPanel content = new JPanel(new BorderLayout());

        final ChartPanel chartPanel = new ChartPanel(chart);
        content.add(chartPanel);

        final JButton button1 = new JButton("Add Dataset");
        button1.setActionCommand("ADD_DATASET");
        button1.addActionListener(this);

        final JButton button2 = new JButton("Remove Dataset");
        button2.setActionCommand("REMOVE_DATASET");
        button2.addActionListener(this);

        final JPanel buttonPanel = new JPanel(new FlowLayout());
        buttonPanel.add(button1);
        buttonPanel.add(button2);

        content.add(buttonPanel, BorderLayout.SOUTH);
        chartPanel.setPreferredSize(new java.awt.Dimension(500, 270));
        setContentPane(content);

    }

    /**
     * Creates a random dataset.
     *
     * @param name  the series name.
     *
     * @return The dataset.
     */
    private TimeSeriesCollection createRandomDataset(final String name) {
        final TimeSeries series = new TimeSeries(name);
        double value = 100.0;
        RegularTimePeriod t = new Day();
        for (int i = 0; i < 50; i++) {
            series.add(t, value);
            t = t.next();
            value = value * (1.0 + Math.random() / 100);
        }
        return new TimeSeriesCollection(series);
    }

    // ****************************************************************************
    // * JFREECHART DEVELOPER GUIDE                                               *
    // * The JFreeChart Developer Guide, written by David Gilbert, is available   *
    // * to purchase from Object Refinery Limited:                                *
    // *                                                                          *
    // * http://www.object-refinery.com/jfreechart/guide.html                     *
    // *                                                                          *
    // * Sales are used to provide funding for the JFreeChart project - please    *
    // * support us so that we can continue developing free software.             *
    // ****************************************************************************

    /**
     * Handles a click on the button by adding new (random) data.
     *
     * @param e  the action event.
     */
    public void actionPerformed(final ActionEvent e) {

        if (e.getActionCommand().equals("ADD_DATASET")) {
            if (this.datasetIndex < 20) {
                this.datasetIndex++;
                this.plot.setDataset(
                    this.datasetIndex, createRandomDataset("S" + this.datasetIndex)
                );
                this.plot.setRenderer(this.datasetIndex, new StandardXYItemRenderer());
            }
        }
        else if (e.getActionCommand().equals("REMOVE_DATASET")) {
            if (this.datasetIndex >= 1) {
                this.plot.setDataset(this.datasetIndex, null);
                this.plot.setRenderer(this.datasetIndex, null);
                this.datasetIndex--;
            }
        }

    }

    /**
     * Starting point for the demonstration application.
     *
     * @param args  ignored.
     */
    public static void main(final String[] args) {

        final MultipleDatasetDemo1 demo = new MultipleDatasetDemo1("Multiple Dataset Demo 1");
        demo.pack();
        RefineryUtilities.centerFrameOnScreen(demo);
        demo.setVisible(true);

    }

}
