Java Is Open Source Programming Language You Can Download From Java and Java Libraries From http://www.oracle.com.
We provide this code related to title for you to solve your developing problem easily. Libraries which is import in this program you can download from http://www.oracle.com.
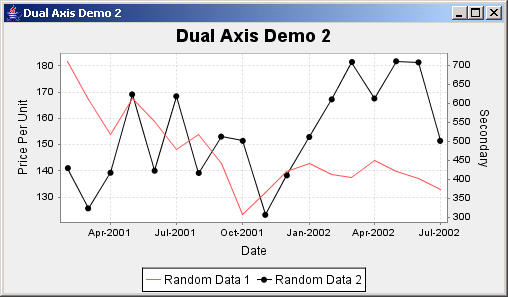
JFreeChart: Dual Axis Demo 2
/* ===========================================================
 * JFreeChart : a free chart library for the Java(tm) platform
 * ===========================================================
 *
 * (C) Copyright 2000-2004, by Object Refinery Limited and Contributors.
 *
 * Project Info:  http://www.jfree.org/jfreechart/index.html
 *
 * This library is free software; you can redistribute it and/or modify it under the terms
 * of the GNU Lesser General Public License as published by the Free Software Foundation;
 * either version 2.1 of the License, or (at your option) any later version.
 *
 * This library is distributed in the hope that it will be useful, but WITHOUT ANY WARRANTY;
 * without even the implied warranty of MERCHANTABILITY or FITNESS FOR A PARTICULAR PURPOSE.
 * See the GNU Lesser General Public License for more details.
 *
 * You should have received a copy of the GNU Lesser General Public License along with this
 * library; if not, write to the Free Software Foundation, Inc., 59 Temple Place, Suite 330,
 * Boston, MA 02111-1307, USA.
 *
 * [Java is a trademark or registered trademark of Sun Microsystems, Inc.
 * in the United States and other countries.]
 *
 * ------------------
 * DualAxisDemo2.java
 * ------------------
 * (C) Copyright 2002-2004, by Object Refinery Limited and Contributors.
 *
 * Original Author:  David Gilbert (for Object Refinery Limited);
 * Contributor(s):   -;
 *
 * $Id: DualAxisDemo2.java,v 1.17 2004/05/21 10:09:10 mungady Exp $
 *
 * Changes
 * -------
 * 19-Nov-2002 : Version 1 (DG);
 * 27-Apr-2004 : Updated for changes to the XYPlot class (DG);
 *
 */

package org.jfree.chart.demo;

import java.awt.Color;
import java.text.SimpleDateFormat;

import org.jfree.chart.ChartFactory;
import org.jfree.chart.ChartPanel;
import org.jfree.chart.JFreeChart;
import org.jfree.chart.axis.DateAxis;
import org.jfree.chart.axis.NumberAxis;
import org.jfree.chart.labels.StandardXYToolTipGenerator;
import org.jfree.chart.plot.XYPlot;
import org.jfree.chart.renderer.xy.StandardXYItemRenderer;
import org.jfree.chart.renderer.xy.XYItemRenderer;
import org.jfree.data.time.Month;
import org.jfree.data.time.TimeSeries;
import org.jfree.data.time.TimeSeriesCollection;
import org.jfree.data.xy.XYDataset;
import org.jfree.ui.ApplicationFrame;
import org.jfree.ui.RefineryUtilities;

/**
 * An example of a time series chart.  For the most part, default settings are used, except that
 * the renderer is modified to show filled shapes (as well as lines) at each data point.
 *
 */
public class DualAxisDemo2 extends ApplicationFrame {

    /**
     * A demonstration application showing how to create a time series chart with dual axes.
     *
     * @param title  the frame title.
     */
    public DualAxisDemo2(final String title) {

        super(title);

        // create a title...
        final String chartTitle = "Dual Axis Demo 2";
        final XYDataset dataset = createDataset1();

        final JFreeChart chart = ChartFactory.createTimeSeriesChart(
            chartTitle,
            "Date",
            "Price Per Unit",
            dataset,
            true,
            true,
            false
        );

  //      final StandardLegend legend = (StandardLegend) chart.getLegend();
    //    legend.setDisplaySeriesShapes(true);

        final XYPlot plot = chart.getXYPlot();
        final NumberAxis axis2 = new NumberAxis("Secondary");
        axis2.setAutoRangeIncludesZero(false);
        plot.setRangeAxis(1, axis2);
        plot.setDataset(1, createDataset2());
        plot.mapDatasetToRangeAxis(1, 1);
        final XYItemRenderer renderer = plot.getRenderer();
        renderer.setToolTipGenerator(StandardXYToolTipGenerator.getTimeSeriesInstance());
        if (renderer instanceof StandardXYItemRenderer) {
            final StandardXYItemRenderer rr = (StandardXYItemRenderer) renderer;
            rr.setPlotShapes(true);
            rr.setShapesFilled(true);
        }

        final StandardXYItemRenderer renderer2 = new StandardXYItemRenderer();
        renderer2.setSeriesPaint(0, Color.black);
        renderer2.setPlotShapes(true);
        renderer.setToolTipGenerator(StandardXYToolTipGenerator.getTimeSeriesInstance());
        plot.setRenderer(1, renderer2);

        final DateAxis axis = (DateAxis) plot.getDomainAxis();
        axis.setDateFormatOverride(new SimpleDateFormat("MMM-yyyy"));

        final ChartPanel chartPanel = new ChartPanel(chart);
        chartPanel.setPreferredSize(new java.awt.Dimension(500, 270));
        setContentPane(chartPanel);

    }

    /**
     * Creates a sample dataset.
     *
     * @return The dataset.
     */
    private XYDataset createDataset1() {

        final TimeSeries s1 = new TimeSeries("Random Data 1", Month.class);
        s1.add(new Month(2, 2001), 181.8);
        s1.add(new Month(3, 2001), 167.3);
        s1.add(new Month(4, 2001), 153.8);
        s1.add(new Month(5, 2001), 167.6);
        s1.add(new Month(6, 2001), 158.8);
        s1.add(new Month(7, 2001), 148.3);
        s1.add(new Month(8, 2001), 153.9);
        s1.add(new Month(9, 2001), 142.7);
        s1.add(new Month(10, 2001), 123.2);
        s1.add(new Month(11, 2001), 131.8);
        s1.add(new Month(12, 2001), 139.6);
        s1.add(new Month(1, 2002), 142.9);
        s1.add(new Month(2, 2002), 138.7);
        s1.add(new Month(3, 2002), 137.3);
        s1.add(new Month(4, 2002), 143.9);
        s1.add(new Month(5, 2002), 139.8);
        s1.add(new Month(6, 2002), 137.0);
        s1.add(new Month(7, 2002), 132.8);

        final TimeSeriesCollection dataset = new TimeSeriesCollection();
        dataset.addSeries(s1);

        return dataset;

    }

    /**
     * Creates a sample dataset.
     *
     * @return The dataset.
     */
    private XYDataset createDataset2() {


        final TimeSeries s2 = new TimeSeries("Random Data 2", Month.class);
        s2.add(new Month(2, 2001), 429.6);
        s2.add(new Month(3, 2001), 323.2);
        s2.add(new Month(4, 2001), 417.2);
        s2.add(new Month(5, 2001), 624.1);
        s2.add(new Month(6, 2001), 422.6);
        s2.add(new Month(7, 2001), 619.2);
        s2.add(new Month(8, 2001), 416.5);
        s2.add(new Month(9, 2001), 512.7);
        s2.add(new Month(10, 2001), 501.5);
        s2.add(new Month(11, 2001), 306.1);
        s2.add(new Month(12, 2001), 410.3);
        s2.add(new Month(1, 2002), 511.7);
        s2.add(new Month(2, 2002), 611.0);
        s2.add(new Month(3, 2002), 709.6);
        s2.add(new Month(4, 2002), 613.2);
        s2.add(new Month(5, 2002), 711.6);
        s2.add(new Month(6, 2002), 708.8);
        s2.add(new Month(7, 2002), 501.6);

        final TimeSeriesCollection dataset = new TimeSeriesCollection();
        dataset.addSeries(s2);

        return dataset;

    }

    // ****************************************************************************
    // * JFREECHART DEVELOPER GUIDE                                               *
    // * The JFreeChart Developer Guide, written by David Gilbert, is available   *
    // * to purchase from Object Refinery Limited:                                *
    // *                                                                          *
    // * http://www.object-refinery.com/jfreechart/guide.html                     *
    // *                                                                          *
    // * Sales are used to provide funding for the JFreeChart project - please    *
    // * support us so that we can continue developing free software.             *
    // ****************************************************************************

    /**
     * Starting point for the demonstration application.
     *
     * @param args  ignored.
     */
    public static void main(final String[] args) {

        final DualAxisDemo2 demo = new DualAxisDemo2("Dual Axis Demo 2");
        demo.pack();
        RefineryUtilities.centerFrameOnScreen(demo);
        demo.setVisible(true);

    }

}
